Working with Mplus to create plots can be frustrating, especially with a Mac. It lacks tools for customizing basic features, such as the title of the plot. This led me to modify Mplus' provided R script for plotting so these features can be edited.
I published the updated script and an accompanying tutorial here to help others who may encounter the same problems.
I published the updated script and an accompanying tutorial here to help others who may encounter the same problems.
|
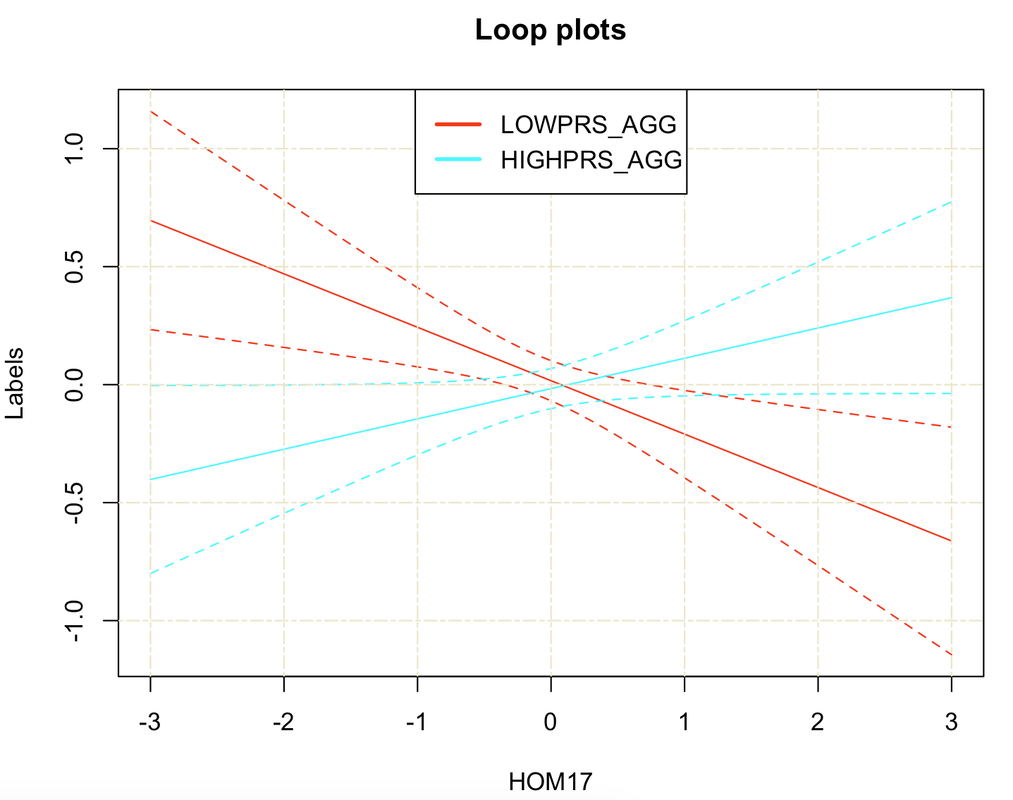
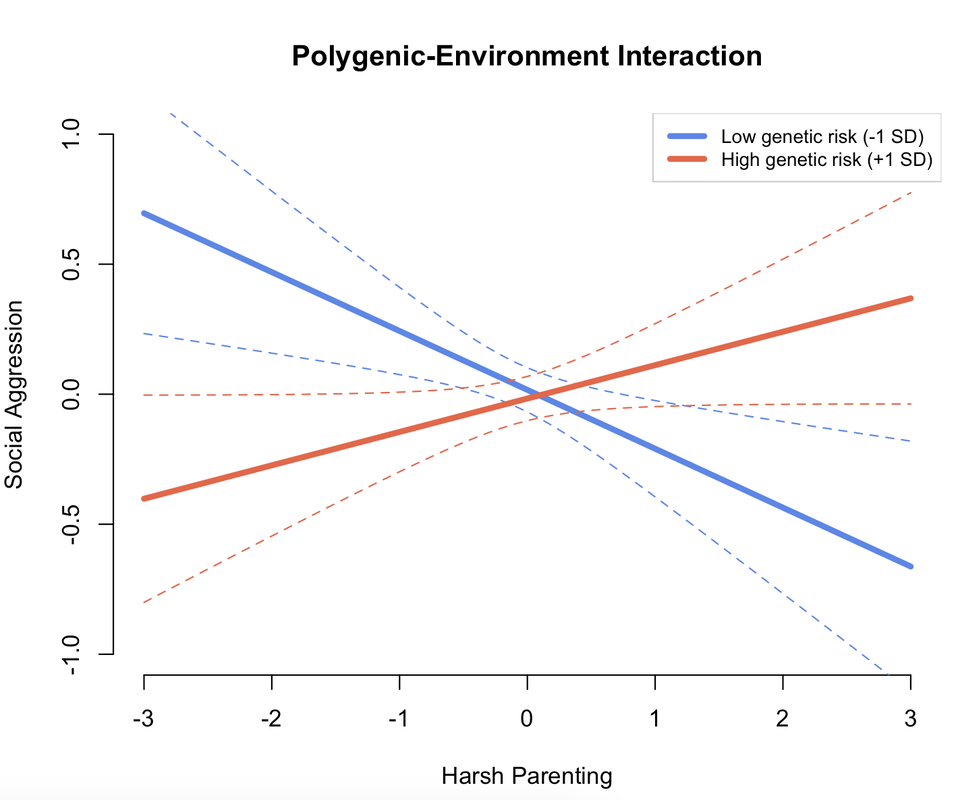
<- How to go from this... ...to this ->
|
|
